|
|
|

Welcome to the Help Guide for the ShopperTrak
Retail Traffic Analyzer. You'll find tips and instructions for using the tool's
features, as well as a glossary of important terms. The guide is divided into the following
sections with a glossary included at the end.
If you require further assistance in using
Retail Traffic Analyzer, please contact your ShopperTrak Client Manager or call
ShopperTrak Support Services at 1-800-883-4RCT (4728). You may also contact ShopperTrak Support
Services via email at support@shoppertrak.com.
Topic
How do I get started on Retail Traffic Analyzer?
What should I do if I am unable to access the site?
What is my user id and password?
What should I do if I’ve forgotten my password?
How do I view reports in languages other than English?
How do I change my default time zone preference?
For which location is data being displayed?
Can I view data for a different location on the
dashboard?
How often is the data updated?
What does the KPI Report indicate?
What does the Detailed Week-to-Date Report indicate?
What does the Customer Traffic/SRTI Graph indicate?
What does the Customer Traffic/Conversion Graph indicate?
Can I switch between dashboards?
How do I use the calendar tool?
Is there a quick way to jump from period to period?
Is there a quick way to jump between toolkits?
When do I need to use the Execute Button?
How do I print a Portfolio/Property Tool screen?
How do I view last year's data?
Can I view only Comp Store results?
Why are some results color-coded?
Can I sort rows by a particular measurement?
What is the "What If.." conversion rate tool?
How do I export my results to a spreadsheet?
How do I set the default period type?
How do I set default Begin/End dates?
How do I set a default hierarchy?
Can I set new defaults for the color-coding system?
How do I set the default "What If" parameters?
How do I set the default calendar type?
How do I set the default window size?
How do I select which sites will appear in a report?
How do I use the calendar tool?
Can I select particular days of the week?
Can I group results by period?
How do I include a graph in a report?
How do I export the data to a spreadsheet?
How do I generate a PDF of a report?
How do I email my report data?
How can I run an ad-hoc report?
How do I select measures for a Cross Metrics report?
How do I highlight report cells based on pre-defined
threshold values in the Cross Metrics report?
How can I view
lower levels of the hierarchy within a report?
How do I create a favorite report?
How do I change the names of my favorite reports or
delete them?
The period numbers in the grid don't match my
fiscal/standard calendar. Why?
I tried to run a report, but the application did not
return any data. Why?
Daily Performance Indicators Report
Daily Sales Summary Report (Uncover Opportunity)
Location Detail by Hour Report
Traffic Contribution by DOW (Day of Week)
Comp Store Daily Sales Summary Report
Cross Metrics Comparison by Location Report
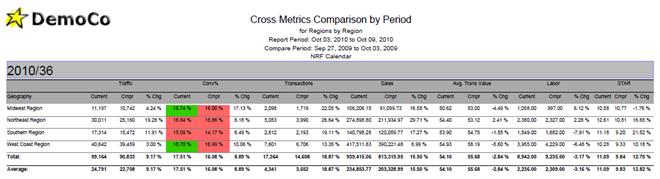
Cross Metrics Comparison by Period Report
![]()
Topics
include:
·
How
do I get started on Retail Traffic Analyzer?
·
What
should I do if I am unable to access the site?
·
What
is my user id and password?
·
How
do I change my password?
·
What
should I do if I’ve forgotten my password?
·
How
do I view reports in languages other than English?
·
How can I set my default time zone
preference?
How
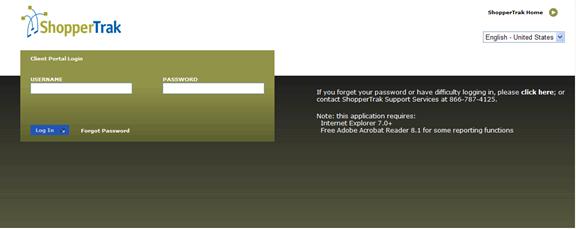
do I get started on Retail Traffic Analyzer?
Every computer
used to access Retail Traffic Analyzer must be running Internet Explorer
version 7.0 or greater (other browsers are not supported), have Adobe Acrobat
reader version 8.1 or greater, and a connection to the internet. Note Adobe Acrobat Reader is
downloadable for free at http://www.adobe.com/products/acrobat/readstep.html.
The URL for
Retail Traffic Analyzer is:
https://portal.shoppertrak.com
What should I do if I am unable to access
the site?
1. Clear your temporary
internet files
a. Tools
b. Internet Options
c. Browsing History
d. Delete (Temporary Internet Files and Cookies)
e. Close and restart
Internet explorer
2. Ensure Internet
Explorer is enabled to show images
a. Tools
b. Internet Options
c. Select the
“Advanced” tab
d. Scroll down to
“Multimedia”
e. Ensure “Show
pictures” is checked
f. Close and restart
Internet Explorer
3. Add site to Trusted
Sites list
a. Tools
b. Internet Options
c. Select the “Privacy”
tab
d. Select the “Trusted
sites” icon
e. Select the “Sites”
button
f. Enter
https:\\portal.shoppertrak.com and select “Add”
If the issue is not resolved, or is
temporarily resolved and recurs, the following link is a great resource for
your Administrator to follow to troubleshoot further. Changes to Program Files
or Firewall Rules on your computer or network may be needed.
http://support.microsoft.com/kb/283807
Please understand that ShopperTrak must ask
the end user’s technology team to be involved in any changes beyond these
suggestions. This is to ensure any
potential solutions we provide do not conflict with the user’s Information
Technology policies.
What
is my user id and password?
Your user id and password are automatically
generated when ShopperTrak begins your service.
In most cases, your user id and password will be provided to you by your
ShopperTrak Client Manager.
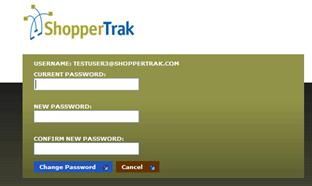
To change your password:
1.
Click
on "My Preferences" in the left-hand navigation bar.
2.
Select
"Change Password".
3.
Enter
your existing password in the "Current Password" field.
4.
In
the "New Password" and "Confirm New Password" fields, type
a new password with a minimum of six characters.
5.
Click
“Change Password” to submit the change.
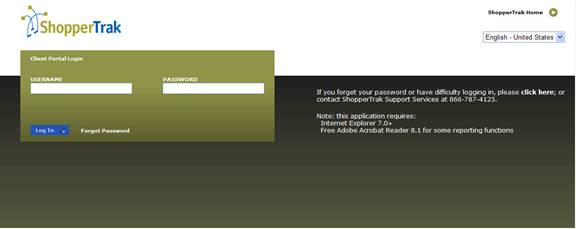
What should I do if I’ve forgotten my password?
If you’ve
forgotten your password, simply select “Forgot Password” on the login
page. You will be taken to a screen
where you will input your username. At
that time, a temporary password will be emailed to the email address associated
with your account. You can then login
with the temporary password at which point you will be prompted to change your
password to something that only you will know.
![]()
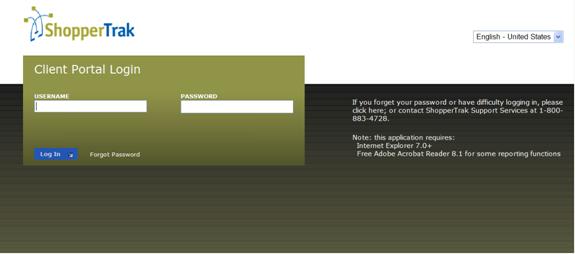
How do I view reports in languages other than
English?
Currently
several RTA
reports and the legacy dashboard are available in Chinese (Mandarin), English,
French, Spanish, and German. If you wish
to change your reporting language, first select the language you wish to view
on the RTA login screen from the upper right-hand side drop-down box.
![]()
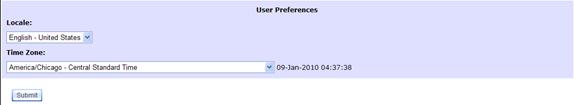
Once you have logged-in in your new
language you must change your reporting language by following these steps:
1. Click on "My
Preferences" in the left-hand navigation bar.
2.
Select
"Change Settings".
3.
Select
the language you wish to view from the “Locale:” drop-down box.
4.
Click
“Submit”.
![]()
There are currently 10 RTA reports that are
available in multiple languages:
·
Location Detail by Hour
·
Comp Store Traffic/Transactions/Conversion
·
Hourly Performance Measurements
How
do I change my default time zone preference?
ShopperTrak
Portal users are able to select their preferred time zone. The default time is Central Time. If you reside in a different time zone, you
may change your default time zone so that the system will recognize your local
area.
![]()
To change your time
zone:
1. Click on "My
Preferences" in the left-hand navigation bar.
2. Select "Change
Settings".
3. Select the preferred
time zone from the “Time Zone:” drop-down box.
4. Click “Submit”.
The Dashboard is the home page of the
Retail Traffic Analyzer. Topics include:
·
For
which location is data being displayed?
·
Can
I view data for a different location on the dashboard?
·
How
often is the data updated?
·
What
does the KPI Report indicate?
·
What
does the Detailed Week-to-Date Report indicate?
·
What
does the Customer Traffic/SRTI Graph indicate?
·
What
does the Customer Traffic/Conversion Graph indicate?
·
Can
I switch between dashboards?
For which location
is data being displayed?
When you first open up RTA, the dashboard
will show the data corresponding to your home store or geographic region. If you
select a different location, the next time you login you will see data for the
last location selected. You can find out
which location is being displayed by viewing the “Current Location:” title at
the top of the dashboard.
Can I view data for
a different location on the dashboard?
If your company has granted you sufficient
privileges, you can view results for other stores, regions or districts by
clicking on “Click Here to Change Location”
To change your dashboard location:
1.
Click
on “Click Here to Change Location” at the top of the dashboard.
2.
A
new window will open prompting you to select a hierarchy from a drop-down box.
3.
After
you have selected a hierarchy, you will see the treeview for that hierarchy.
4.
Click
on the circle next to the geographic location whose data you wish to view.
5.
Click
“OK”.
6.
Data
for the new location will now appear on the dashboard.
How
often is the data updated?
In most cases, traffic data for the
previous day is available by 10:00 a.m. in the Dashboard and Reports.
What does the KPI
Report indicate?
This table shows your location’s
performance across several metrics (Traffic, Conversion, Sales, STAR) for
several timeframes (Yesterday, Week-to-Date, Month-to-Date, Year-to-Date). Directional arrows show performance on a
year-over-year comparison.
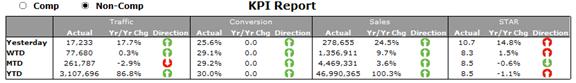
Please Note: If your company does not
provide sales or labor data to ShopperTrak, the chart will only display traffic
information.
The KPI Report defaults to Non-Comp,
meaning it will pull in data from all stores.
If you wish to view only the data for stores that were open in the
Current AND Prior Year periods, click on the “Comp” radio button in the upper
left-hand corner of the report. The
report will refresh with the “Comp” data.
What does the
Detailed Week-to-Date Report indicate?
This table is designed to give you a quick
view into your location’s performance during the current week. The days in the week that have already
occurred will appear in the table.
Metrics include: Traffic,
Conversion, Sales, Aver. Sales/Transaction, STAR, and Sales per Shopper
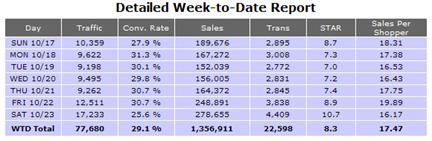
Please Note: If your company does not
provide sales or labor data to ShopperTrak, the chart will only display traffic
information.
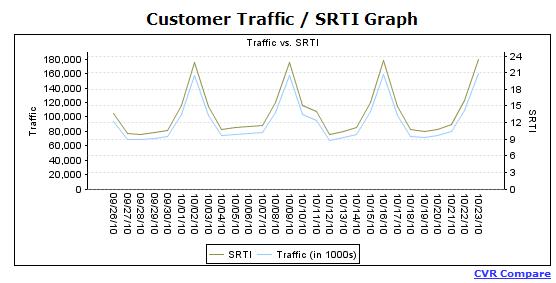
What does the
Customer Traffic/SRTI Graph indicate?
The graph is used for comparing your
location’s traffic performance versus the industry average for the past 28
days. Traffic for your location is represented by the light blue line. The
ShopperTrak Retail Traffic Index (SRTI) trend is represented by a dark green
line. The graph ends with the most recent Saturday. SRTI data is updated every Tuesday.
Drawn from a sample of ShopperTrak’s 45,000 mall and retail installations,
the ShopperTrak Retail Traffic Index (SRTI) is the only product that looks at
national, regional and segment traffic trends, and allows you to benchmark your
stores’ performance to them. With a broader perspective on traffic, you can see
the impact of weather, seasonal changes, holidays, energy prices and other
events on customer counts.
The SRTI Gives You Necessary Market
Intelligence
·
Compare your own traffic trends to
changes in traffic at national, regional and retail segment levels
·
Uncover differences in shopper
traffic between regions or retail segments
·
Assess the effect of marketing
programs on your traffic, relative to segment or regional performance
·
Evaluate the impact of holidays,
weather, energy prices, national events and other factors on retail traffic
Indices for Five Industry Segments
·
Total
·
·
Special segment reporting for:
·
Apparel and Accessories Stores
·
Wireless and Electronics Stores
Data Indexed at Five Geographic
Levels
·
National
·
Regional by Census division
·
(Northeast,
Please note that the SRTI data represented
in this graph is for the Total U.S. Retail Traffic index. If you are interested in obtaining access to
other segments or geographic levels, SRTI subscriptions are available. The SRTI
subscription is priced by individual segment and by region so you only pay for
the data you need. For more information please contact your ShopperTrak
representative.
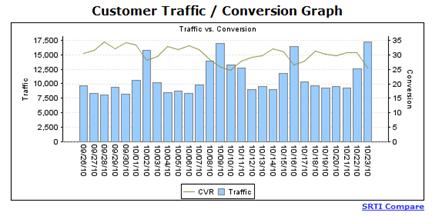
What does the
Customer Traffic/Conversion Graph indicate?
If you aren’t interested in comparing your
location traffic to the SRTI, you do have the option to compare your traffic to
your conversion rate. Click on the “CVR
Compare” link below and to the right of the Customer Traffic/SRTI Graph and
that graph will be replaced with the Customer Traffic/Conversion Graph. This graph shows your location’s traffic
count and conversion rate for the past 28 days. Traffic is represented by the
light blue area. Conversion is represented by a dark green line. If you wish to return to the Customer
Traffic/SRTI Graph, click on the “SRTI Compare” link below and to the right of
the Customer Traffic/Conversion Graph.
Can I switch between
dashboards?
If you wish to view the legacy dashboard,
click on the “Click here for legacy dashboard” link on the top right
hand side of the screen. To switch back
to the standard dashboard, click on the “Click here for new dashboard”
link.
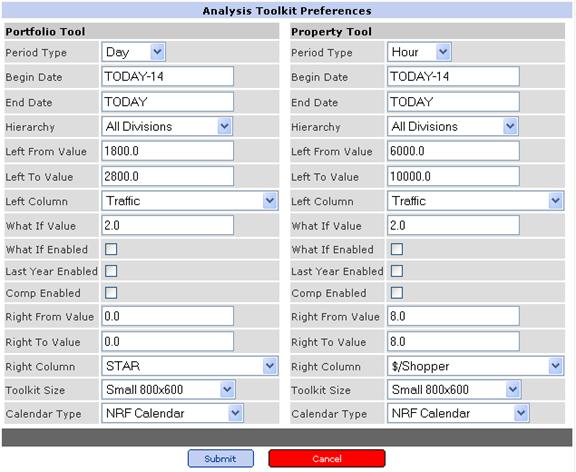
There are two tools within the Analysis
Toolkit: the Portfolio Tool and the
Property Tool.
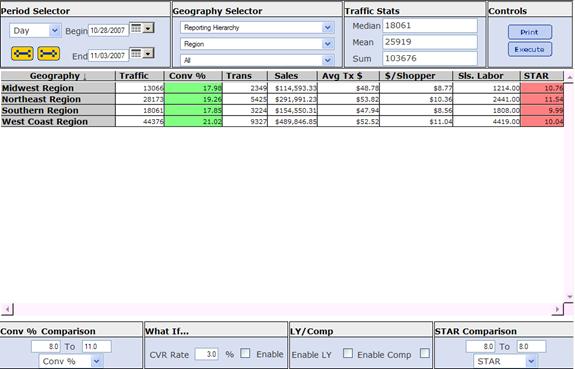
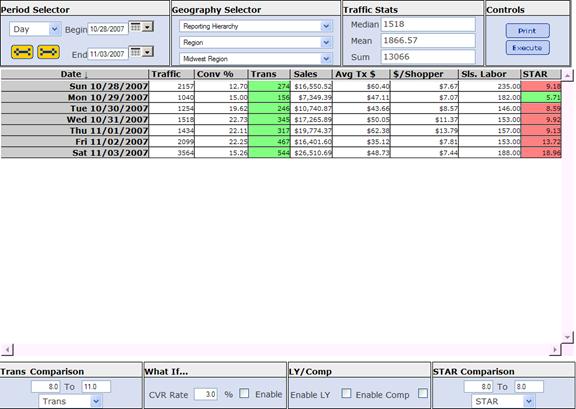
The Portfolio Tool, as seen below, allows
you to manipulate data related to your complete roster of stores, as well as,
regions and districts for a single time period.
The Property Tool, as seen below, allows you
to view data related to a particular store, region or district across many time
periods.
Topics include:
·
How
do I use the calendar tool?
·
How
do I select time periods?
·
Is
there a quick way to jump from period to period?
·
Is
there a quick way to jump between toolkits?
·
How
do I select locations?
·
When
do I need to use the Execute Button?
·
How
do I use the Stats area?
·
How
do I print a Portfolio/Property Tool screen?
·
How
do I view last year’s data?
·
Can
I view only Comp Store results?
·
Why
are some results color-coded?
·
Can
I sort rows by a particular measurement?
·
What
is the “What If…” conversion rate tool?
·
How
do I export my results to a spreadsheet?
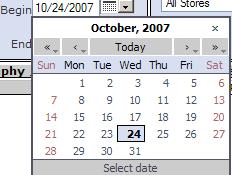
How
do I use the calendar tool?
To move the calendar back one month, click the "<" icon. To
advance the calendar one month, click ">." To move the calendar
more than one month in either direction, click the appropriate arrow and hold
it down. Then select the desired month from the list.
The "<<" and ">>" icons work in the same
fashion, but allow you to shift years, rather than months.
There are two steps involved in selecting a time period — first selecting the
period itself, and then specifying the actual date range.
·
Period Selector
This drop-down menu allows you to select the time period you want to analyze.
"Day," "Week," "Month," "Quarter" and
"Year'" are available options in the Portfolio Tool. Within the
Property Tool, there is also an option for selecting "Hour".
·
Once you have selected the period, you can specify the range of dates by using
the "Begin" and "End" fields. The dates must correspond to
the selected time period.
Please Note: If you enter dates
that are incompatible with the period, the tool will default to results for the
entire period. That is, if you select "Month," but enter the dates 10/07/2007
and 10/14/2007, you will see results for the entire month of October.
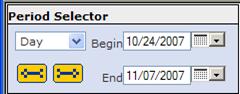
Is there a quick way to jump from period to period?
Yes. Let's say you have just been examining
data for the week beginning 10/21/2007 and ending 10/27/2007. But now you want
to view data for the week immediately following this. Click on the Forward
Arrow Button beneath the Period Selector. This will advance the tool one week,
to 10/28/2007 – 11/3/2007. Clicking on the Back Arrow Button reverses the date
in the same fashion. In the example above, it would allow you to view data for
the week beginning 10/14/2007 and ending 10/20/2007.
This functionality is also available for "Months,"
"Quarters" and "Years."
Is
there a quick way to jump between toolkits?
Yes. If you are in Portfolio Tool and wish to view data for a particular
property, just click on the name of that property or region. This will display
data for that location in the same time period.
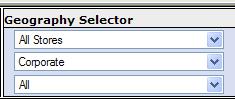
The three controls in the Geography Selector determine which locations will be
displayed.
Begin with the top-most drop-down menu, the Hierarchy Selector, and choose the
appropriate location. (Depending on how your organization chooses to classify
its locations, there may be only one option in this section, or there may be
many. Possible classifications include shopping center type, square footage,
remodel year, test status, etc.) From the middle drop-down menu, select the
appropriate Level. Possible levels include "Store,"
"District," "Region" and "Portfolio." And
finally, select the appropriate Member.
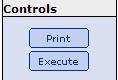
When
do I need to use the Execute Button?
If you change a "Begin" or "End" date, you must click
"Execute" to process your results. For all other variables, the tool
will update automatically when you change your selection.
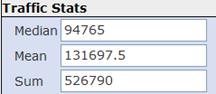
This area is intended to display the "Median," "Mean" and
"Sum" amounts for a particular measurement.
"Median" - the value at which
half of the data points lie above and half lie below.
"Mean" - the average. That is,
the sum of the values, divided by the number of values.
"Sum" - all the values added
together. (This is not available for certain "calculated"
measurements, such as the Conversion Rate).
To calculate the "Median,"
"Mean" and "Sum" for a measurement, mouse over it in the
column headings.
How
do I print a Portfolio/Property Tool screen?
Click the "Print" button in the
upper-right corner of the screen.
This will launch Adobe Reader with the
corresponding data loaded into a .PDF file.
Print the PDF as you would any other
document.
How
do I view last year's data?
In both the Portfolio and Property Tools, you can view data for the current and
previous years simultaneously. To do this, check "Enable LY" box at
the bottom of the screen.
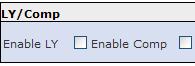
Can
I view only Comp Store results?
By default, the tools will show results for all stores. To view Comp Store
results only, check the "Enable Comp" box in the lower-right corner
of the screen.
Why
are some results color-coded?
To aid your analysis, you can set desired minimum and maximum limits for
certain measurements. Results that fall outside these boundaries are then
flagged by a color change. Results that exceed your maximum appear in green,
while those that do not meet your minimum are highlighted in red. If a result
lies between your specified limits, it remains white. The exception to this is
the "STAR" measurement. When working with "STAR," stores
above the maximum appear in red, while those below the minimum appear in green.
To specify limits:
Select the measure you would like to
color-code from one of the two drop-down menus at the bottom of the screen.
(These are located in the lower-left and lower-right corners.)
Specify minimum and maximum limits using
the text boxes to the left of the measurement.
Can
I sort rows by a particular measurement?
Yes. Click on the column heading of the measurement you wish to sort by. You
can also reverse the order in which the results appear by clicking on the
column heading a second time. For example, if the "Traffic" column is
currently displaying your data in a highest-to-lowest format, a second click
will reverse this configuration, displaying the lowest value first.
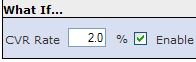
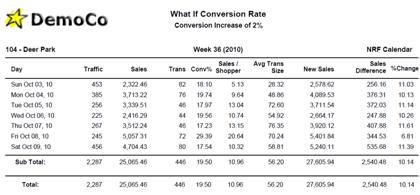
What
is the "What If.." conversion rate tool?
This tool is designed to help you visualize the effect that an increase in
conversion would have on your sales. To use the "What If..." tool:
Enter a percentage-point increase in the
"CVR Rate %" field (located at the bottom of the screen).
Check "Enable."
The tool will then insert new columns in
the grid, indicating the hypothetical increase in sales amount, sales gain and
sales gain percentage.
How
do I export my results to a spreadsheet?
The data that appears in your Portfolio and Property Tools can be used in
Microsoft Excel.
Highlight the area of the report you wish
to use in Excel.
Right-click and select “Copy”.
Launch Microsoft Excel and paste the data
into a spreadsheet.
·
How
do I set the default period type?
·
How
do I set default Begin/End dates?
·
How
do I set a default hierarchy?
·
Can
I set new defaults for the color-coding system?
·
How
do I set the default “What If” parameters?
·
How
do I set the default calendar type?
·
How
do I set the default window size?
How
do I set the default period type?
To specify the default period type in the Portfolio or Property Tools:
·
Select
"Analysis Toolkit" from the left-hand navigation, then click on
"Toolkit Prefs."
·
Locate
the tool you want to work with.
·
Select
the appropriate period from the "Period Type" drop-down menu.
·
Click
"Submit."
How
do I set default Begin/End dates?
To specify the default beginning and ending dates in the Portfolio or Property
Tools:
·
Select
"Analysis Toolkit" from the left-hand navigation, then click on
"Toolkit Prefs."
·
Locate
the tool you want to work with.
·
Enter
your desired dates in the "Begin Date" and "End Date"
fields. These can be expressed as MM/DD/YYYY or as "TODAY-X." In the
latter configuration, "TODAY" represents the current date and
"X" represents a certain number of days in the past. (For example:
"TODAY-7" would be seven days prior to today.)
·
Click
"Submit."
How
do I set a default hierarchy?
To specify the default reporting hierarchy in the Portfolio or Property Tools:
·
Select
"Analysis Toolkit" from the left-hand navigation, then click on
"Toolkit Prefs."
·
Locate
the tool you want to work with.
·
Select
the desired hierarchy from the "Hierarchy" drop-down box.
·
Click
"Submit."
Can
I set new defaults for the color-coding system?
Yes. The rows in the Portfolio and Property Tools can be color-coded by any two
measurements. To change the default color-coding:
·
Select
"Analysis Toolkit" from the left-hand navigation, then click on
"Toolkit Prefs."
·
Locate
the tool you want to work with.
·
Select
the first measurement you want to color-code from the list in the "Left
Column" drop-down menu.
·
Specify
your minimum limit in the "Left From Value" field.
·
Specify
your maximum limit in the "Left to Value" field.
·
If
you want to set default color-coding for a second measurement, repeat Steps 3,
4 and 5 using the "Right Column," "Right From Value" and
"Right to Value" fields.
·
Click
"Submit."
Then, when the measurement exceeds the
maximum you specified, it will appear in green. When it falls below the
minimum, it will appear in red. When it lies between the two bounds, it will
remain white. There is one exception: When working with "STAR,"
stores above the maximum appear in red, while those below the minimum appear in
green.
How
do I set the default "What If" parameters?
To change the default "What If" parameters in the Portfolio or
Property Tools:
·
Select
"Analysis Toolkit" from the left-hand navigation, then click on
"Toolkit Prefs."
·
Locate
the tool you want to work with.
·
Place
a check next to "What If Enabled" to activate this feature by
default. Un-check the box to deactivate this feature.
·
Enter
a default value in the "What If Value" field.
·
Click
"Submit."
How
do I set the default calendar type?
To specify the default calendar for the Portfolio or Property Tools:
·
Select
"Analysis Toolkit" from the left-hand navigation, then click on
"Toolkit Prefs."
·
Locate
the tool you want to work with.
·
Select
the desired calendar from the "Calendar Type'" drop-down menu.
·
Click
"Submit."
How
do I set the default window size?
To specify the default window size in the Portfolio or Property Tools:
·
Select
"Analysis Toolkit" from the left-hand navigation, then click on
"Toolkit Prefs."
·
Locate
the tool you want to work with.
·
Select
the desired window size from the "Toolkit Size" drop-down menu.
·
Click
"Submit."
![]()
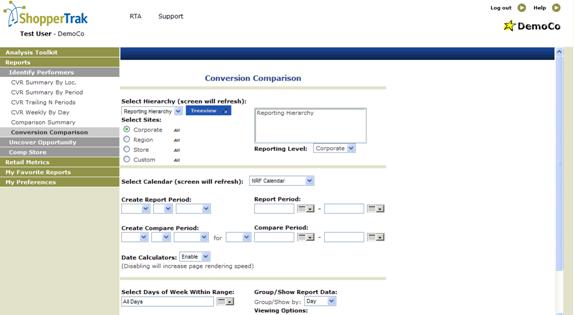
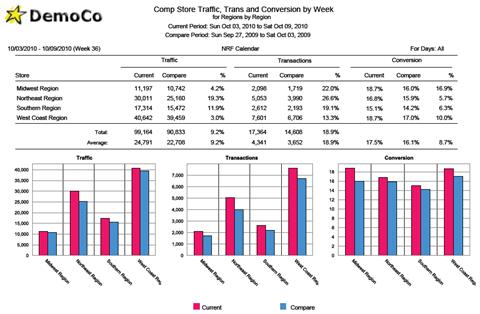
The main “Reports” section is divided into three report categories: Identify Performers, Uncover Opportunity and
Comp Store. The Identify Performers reports allow you to assess performance
with a focus on conversion rate across certain time periods. The Uncover
Opportunity reports drill down to the day and hour levels to identify trends
and opportunities. The Comp Store reports allow you to compare this year's
results with last year's by incorporating comp store logic into the reporting. There is an additional section of reports
called “Retail Metrics”. This section
contains two reports: Cross Metrics
Comparison by Location and Cross Metrics Comparison by Period. These ad-hoc reports allow you to choose
which measures you wish to view, as well allow you to set thresholds that will
create shading on the reports.
If you would like hardcopy samples of all
the available Retail Traffic Analyzer reports contact your ShopperTrak Client
Manager. He or she will provide you with
a complete set of reports.
REPORT DEFINITIONS:
To learn more about
the function of a particular report and what it measures, locate its name in
the Glossary of Terms.
SETTING PARAMETERS:
·
How
do I select which sites will appear in a report?
·
How
do I use the calendar tool?
·
How
do I select a period?
·
Can
I select particular days of the week?
·
Can
I group results by period?
·
How
do I save a favorite report?
·
How
do I include a graph in a report?
·
How
do I export the data to a spreadsheet?
·
How
do I generate a PDF of a report?
·
How
do I email my report data?
·
How
can I run an ad-hoc report?
·
How
do I select measures for a cross-metric report?
·
How
do I highlight report cells based on pre-defined threshold values in the Cross
Metrics report?
·
How
can I view lower levels of the hierarchy within a report?
How
do I select which sites will appear in a report?
Step 1: Select a Hierarchy
The "Select Hierarchy" drop-down menu, located in the upper left of
the screen, allows you to identify the type of location you want to work with.
(Depending on how your organization chooses to classify its locations, there
may be only one option in this section, or there may be many. Possible
classifications include shopping center type, square footage, remodel year,
test status, etc.)
Step 2: Select Sites Using the
Hierarchical List or the "Treeview" tool
When you make your site selections with the hierarchical list, you are working
with categories that have already been established by your organization. If you
want to work with your own customized list of locations, you will need the
"Treeview" tool.
To select sites using the hierarchical list:
1. Locate the "Select Sites" area (just below the "Select
Hierarchy" drop-down menu).
2. Select the desired members from the list of sites (to the right of
the '"Treeview" button).
· To select all locations in a hierarchical
level, click "Select All'" next to the level's name.
· To select multiple locations that are next to
one another on the list, hold down the "Shift" key while clicking.
· To select multiple locations that are not adjacent to one another, hold down the "Control" key while clicking.
To select sites using the
"Treeview" tool:
1. Click the "Treeview" button.
2. Place checks next to the geographic locations whose data you wish to
view. (If you want to see all the members of a geographic location, click on
its name. When you have finished, click again to collapse the window.)
3. When all geographic locations have been selected, click
"OK."
4. Your selections will appear in the list of sites to the right of the
"Treeview'" button.
Step 3: Indicate the Reporting Level
Locate the "Reporting Level" drop-down menu (just below the list of
Selected Sites) and make your selection.
Please Note: Your "Reporting Level" must be of equal or lower
rank than the hierarchical level you selected in Step 2. That is, if you choose
"Region" using "Treeview" or the hierarchical list, then
your "Reporting Level" must be "Region,"
"District" or "Store." It cannot be "Total Company."
How
do I use the calendar tool?
To move the calendar back one month, click the "<" icon. To
advance the calendar one month, click ">." To move the calendar
more than one month in either direction, click the appropriate arrow and hold
it down. Then select the desired month from the list.
The "<<" and ">>" icons work in the same
fashion, but allow you shift years, rather than months.
Step 1: Select a Calendar
Many companies choose to make their Fiscal (Retail) Calendar available to users
of the Retail Traffic Analyzer. Locate the "Select Calendar Type"
heading in the middle of the page, then choose the appropriate calendar from
the drop-down menu. (Depending on your organization, you may be able to choose
among several calendar types, including a Fiscal Calendar.)
Step 2: Define the Report Period
There are three ways to define your "Report Period." You can:
·
Build
a phrase using the "Create Report Period" drop-down menu. (This will
automatically determine your "Begin" and "End" dates.)
·
Enter
customized "Begin" and "End" dates into the "Report
Period" fields. (They must use the format MM/DD/YYYY.)
·
Use
the Calendar Tool (located to the immediate right of the "Report
Period" fields).
Step 3: (When Applicable) Define the
Compare Period
The "Compare Period" feature is not available on all reports. Where
it does appear, you can define your period using any of the three methods
described above.
Can
I select particular days of the week?
For many reports, you can limit the report output to certain days of the week.
·
Locate
the "Select Days of Week Within Range" drop-down menu. (It is located
in the lower left of the screen.)
·
Clicking
on the drop-down arrow will open a small pop-up window.
·
Place
checks next to the days you want to work with, then click "OK."
Can
I group results by period?
Many reports permit you to group your results by time periods. To activate this
feature, choose a time period from the "Group/Show Report Data"
drop-down menu (located at the right of the screen).
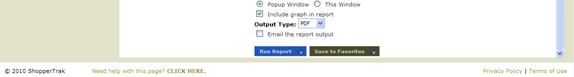
How
do I include a graph in a report?
To include a graph in your report, place a check next to "Include Graph in
Report" (located in the lower-right corner of the screen). Please note that graphs are not available for
every report.
How
do I export the data to a spreadsheet?
To export your report results to Microsoft Excel, select "CSV" from
the "Output Type" drop-down menu (located in the lower-right corner
of the screen). After you click "Run Report," a small pop-up window
will appear and prompt you to either "Open" or "Save" the
newly created Workbook.
How
do I generate a PDF of a report?
To generate a PDF of a report, select "PDF" from the "Output
Type" drop-down menu (located in the lower-right corner of the screen).
After you click "Run Report," Adobe Reader will be launched, and the
report content will be output to a .PDF file that can be printed, saved or
emailed.
How
do I email my report data?
For your convenience, you can email report data directly from the Retail
Traffic Analyzer, but you must select this option before executing the report.
·
After
you have filled in/selected all your settings, place a check next to
"Email the Report Output" (located in the lower-right corner of the
screen).
·
You
will be prompted to enter the names and addresses of the sender and recipients.
You can also enter a subject line and carbon copy other individuals.
·
After
you have entered all your addresses, click "Email Report." (Remember:
The report will be sent immediately, so make sure you've selected all your
settings before clicking "Email Report.")
How
can I run an ad-hoc report?
The Retail Metrics reports allow you to select specific measures to include in
a report and also allow you to choose whether or not to have a comparison
period. You can also enter metric
thresholds that will provide report shading, thereby highlighting areas of
strength and weakness across your locations or time periods.
·
Cross
Metrics Comparison by Location: This
report has each location on a separate page and time periods in the rows.
·
Cross
Metrics Comparison by Period: This
report has each time period on a separate page and locations in the rows.
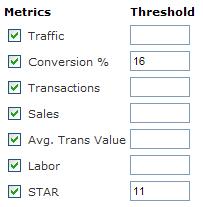
How
do I select measures for a Cross Metrics report?
For the Cross Metrics Comparison Reports, you must
select which measures you wish to view within the report. Locate the "Metrics and Threshold"
selection boxes at the bottom of the page and then click on the check-mark
boxes of the measures you wish to include in your report. Available Measure Types can be viewed in the
picture below.
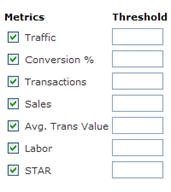
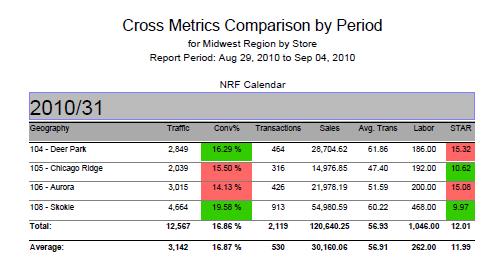
How
do I highlight report cells based on
pre-defined threshold values
in the Cross Metrics report?
In the Cross Metrics Comparison Reports, you are
able to enter parameter threshold values that can be used to indicate data
thresholds on the report. These values
can be used to quickly highlight locations that fall above or below a specific
goal.
Locate the
" Metrics and Threshold " selection boxes at the bottom of the
page. Each metric has a threshold value
box to the right of the metric name.
Enter a value into this field.
When you run the report, values greater than or equal to the entered
threshold will be shaded green and values below will be shaded red. Note that the color coding is reversed for
STAR as a lower STAR is generally more favorable than a higher STAR.


All
cells in the report have been shaded red or green according to the
thresholds entered above.
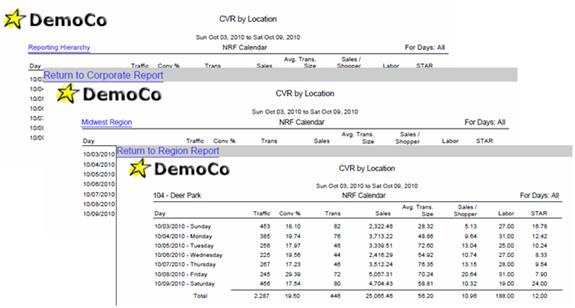
How can I view lower levels of the hierarchy within
a report?
You may navigate
directly to the next level of a hierarchy within a report without returning to
the parameter screen. Click on the
geography level hyperlink. A new window
will open with data reporting at the next level of the hierarchy. You can continue to click on the hyperlinks
until you reach the lowest level of the hierarchy. To move back up the hierarchy, click on the
“Return” link in the upper left-hand corner of the report.
There are 10
reports where this drill-thru functionality is available:
1. Cross Metrics Comparison by Location
2. Cross Metrics Comparison by Period
3. CVR Summary by Location
4. CVR Summary by Period
5. Daily Performance Indicators
6. CVR Weekly by Day
7. Daily Traffic
8. Comp Store Traffic/Trans/Conv
9. Comparison Summary
10. CVR Forecast (What If)
This
functionality is available for Output Types “PDF” and “HTML” for Viewing Option
Type “Popup Window” and it is available for Output Types “HTML” for Viewing
Option Type “This Window”.
Each time you run a report, the settings
you select are remembered by the Retail Traffic Analyzer. So, the next time you
sign on, the same settings will automatically appear. You can also save time by
creating Favorite Reports.
·
How
do I create a favorite report?
·
How
do I change the names of my favorite reports or delete them?
How
do I create a favorite report?
To create a favorite:
·
Go
to the desired report and select the appropriate settings.
·
Click
the "Save to Favorites" button in the lower-right corner of the
screen.
·
Name
your report, then click "Submit." The report will be now be available
when you select "My Favorite Reports" in the left-hand navigation.
Additional Tips:
·
The
"Create Report Period" and "Create Compare Period" controls
can be used to specify a dynamic date range. In other words, using one of these
features will eliminate the need to select new dates when you run your Favorite
Report in the future.
·
You
may need to go through the "Run Report" sequence several times to fine-tune
your settings and arrive at a configuration you want to save. Once you have
found the ideal settings, close the window that your results appear in and
report screen. Now click "Save to Favorites."
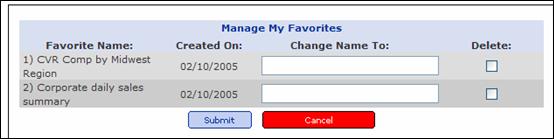
How
do I change the names of my favorite reports or delete them?
1. Click on "Manage My Favorites" under the “My Favorite Reports” heading in
the left-hand navigation bar.
2. Enter the new name you wish to give the report, or click on the box below the “Delete” heading if you with to delete the report from your favorites.
3. Click on “Submit” to either change the report name or have it deleted.
Measures
in Retail Traffic Analyzer include:
·
Traffic (Visitors) = Inbound traffic
count for the period of interest.
·
Conversion
Rate (Conv%, CVR)
= Percentage of shoppers who make a purchase. Calculated by dividing the
transaction count by traffic.
·
Transaction
Count (Trans)
= Number of transactions executed through the POS system. Multiple items
purchased at the same time count as a single transaction.
·
Sales = Total sales
amount, recorded by POS system.
·
Average
Transaction Size (
·
Dollars
per Shopper ($/Shopper) =
·
Sales Labor (Sls.
Labor, Labor (Pers)) = Sales labor hours, reported by the retailer.
o
Please
note that labor when reported on daily, weekly, monthly, quarterly, or yearly
reports is the total of hours worked.
When labor is reported on hourly reports, it is reported as the number
of employees that worked more than 15 minutes during each hour. This is to give a better representation of
the number of employees that were actually available in the store during a
given hour. As such, when hourly data is
summed to a daily total that total number may be higher than the number
reported on a daily report.
§
Example:
If
Employee A worked from 10:00 – 10:20, Employee B worked from 10:00 – 11:00 and
Employee C worked from 10:30 – 11:00, on an hourly report, the number will
appear as 3. On a daily report, this labor
would only account for 1.83 hours.
·
Shopper
to Associate Ratio (STAR) = Average number of shoppers each associate must
service, per hour. Traffic divided by sales labor.
·
Sales per Employee
Hour (SPEH)
= Sales amount divided by sales labor.
·
SRTI (ShopperTrak
Retail Traffic Index) = Index metric representing traffic trend at an
industry-wide level.
![]()
ANALYSIS TOOLKIT:
·
I
selected my desired dates, but the tool returned a different timeframe with my
results. What’s going on?
·
The
period numbers in the grid don’t match my fiscal calendar/standard
calendar. Why?
REPORTS:
·
I
tried to run a report, by the application did not return any data. Why?
·
I
selected my desired dates, but the tool returned a different timeframe with my
results. What’s going on?
It's possible that the specific dates you
entered are incompatible with the Period you selected. In this case, the tool
will default to showing data for Period Level. Let's say, for example, that you
selected "Month" as your time period, but entered the dates to
Try running your query again, paying close attention to the dates and the
Period Level you select. And remember, if you want to control the precise dates
of your results, choose "Day" in the "Period Selector."
The
period numbers in the grid don't match my fiscal/standard calendar. Why?
You may have selected the wrong calendar
when you set your preferences for this tool. To determine if this is the case:
·
Select
"Analysis Toolkit" from the left-hand navigation, then click on
"Toolkit Prefs."
·
Locate
the tool you have been working with.
·
Look
at the calendar type that is currently selected in the "Calendar
Type" drop-down menu. If it is not the one you want you want to use,
select a new calendar.
·
Click
"Submit."
I
tried to run a report, but the application did not return any data. Why?
You may have chosen a "Reporting
Level" that is incompatible with the hierarchical level you selected.
Your "Reporting Level" must be of equal or lower rank than the
hierarchical level you selected. For example: If you choose "Region"
using the "Treeview" or hierarchical list, then the "Reporting
Level" must be "Region," "District" or
"Store." It cannot be "Total Company."
Try running your report again, paying close attention to the "Reporting
Level" and hierarchical levels you select.
Some reports automatically widen the range
of dates selected to encompass the "Group/Show By" Level selected.
These levels include "Week," "Month," "Quarter"
and "Year."
A
Average Transaction Size (
C
Comp Store
A store that has been open and collecting traffic data for at least a year.
Comp Store Logic
When comparing two or more stores across two years, this system ensures that
only data from stores that were open in both years will be included.
Comp Store Reports
A category of reports. All reports in this category allow users to compare
current- and prior-year results for stores that have accrued data for both
periods. Prior-year data is presented automatically. To select a different
comparison period, use the "Compare Period" or "Create Compare
Period" controls.
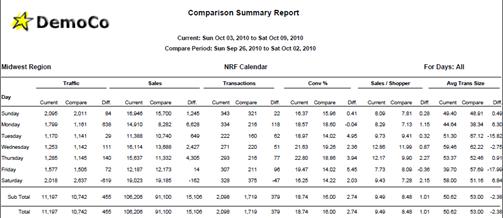
Comparison Summary
A report available in the Identify Performers area. It compares daily totals of
all measurements for two specified periods. The report outputs a separate page
for each location, each week. (Please Note: This report does not contain comp
store logic. For this type of functionality, use the "Comp Store Weekly
Summary" report.)
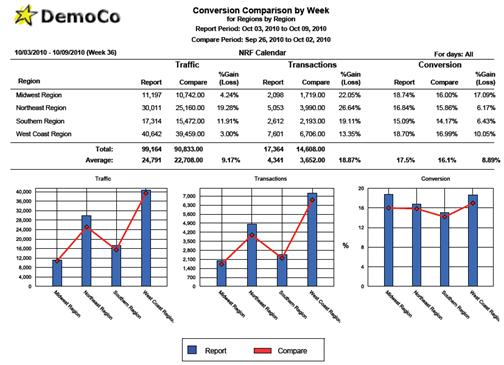
Conversion Comparison
A report available in the Identify
Performers area. It compares traffic, transactions and conversion rate totals
only, for two specified periods. Results can be limited to specific days of the
week. All locations appear on the same page. (Please Note: This report does not
contain comp store logic. For this type of functionality, use the "Comp
Store Traffic/Trans/Conv" report.)
Conversion Rate (Conv%, CVR)
Percentage of shoppers who make a purchase. Calculated by dividing the
transaction count by traffic.
Cross Metrics Comparison by Location
This report compares all measures against
two specified periods or provides the measures for only one period. It can be run with or without comp store
logic and thresholds can be set against any of the metrics to provide shading
for values above and below the thresholds.
The user can select which metrics to include in the report. This report lists time periods in the rows
and outputs a separate page for each location.
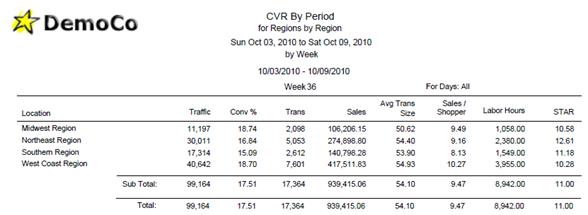
Cross Metrics Comparison by Period
This report compares all measures against
two specified periods or provides the measures for only one period. It can be run with or without comp store
logic and thresholds can be set against any of the metrics to provide shading
for values above and below the thresholds.
The user can select which metrics to include in the report. This report lists locations in the rows and
outputs a separate page for each time period.
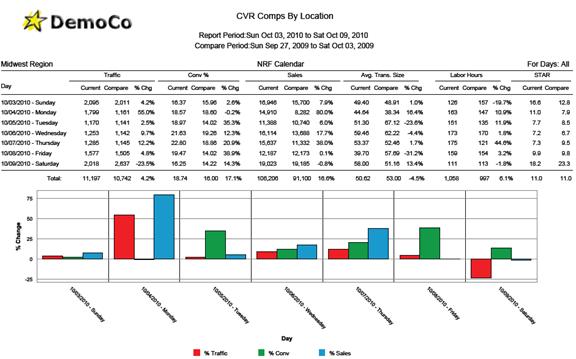
CVR Comps by Location
A report available in the Comp Store area. It lists current- and previous-year
totals of all measurements by period for the selected locations. Results can be
limited to specific days of the week. This report outputs a separate page for
each location and does contain comp store logic.
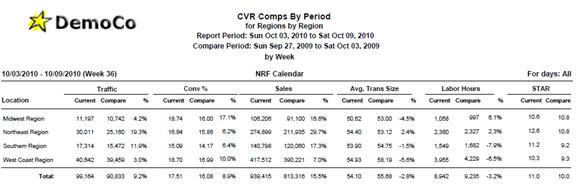
CVR Comps by Period
A report available in the Comp Store area. It lists current- and previous-year
totals of all measures by location for the selected period. Results can be
limited to specific days of the week. This report does contain comp store logic
and outputs a separate page for each "Group/Show By" period.
CVR Forecast (What If...)
A report available in the Uncover Opportunity area. It shows the change in all measurements
for each day in a specified period based on a hypothetical increase in
conversion rate. It outputs a separate page for each location and week.
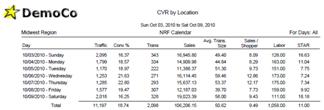
CVR Summary by Location
A report available in the Identify Performers area. It lists totals of all measurements
by period for selected locations. Results can be limited to specific days of
the week. It outputs a separate page for each location.
CVR Summary by Period
A report available in the Identify Performers area. It lists totals of all
measurements by location for the selected period. Results can be limited to
specific days of the week. It outputs a separate page for each "Group/Show
By" period.
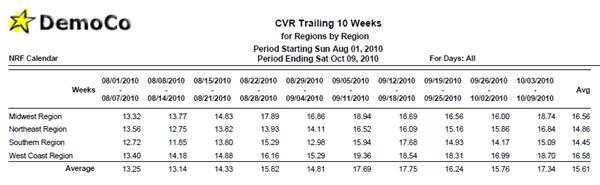
CVR Trailing N Periods
A report available in the Identify Performers area. It displays average conversion
rate by location for up to 12 trailing periods. Results can be limited to
specific days of the week. All locations appear on the same page.
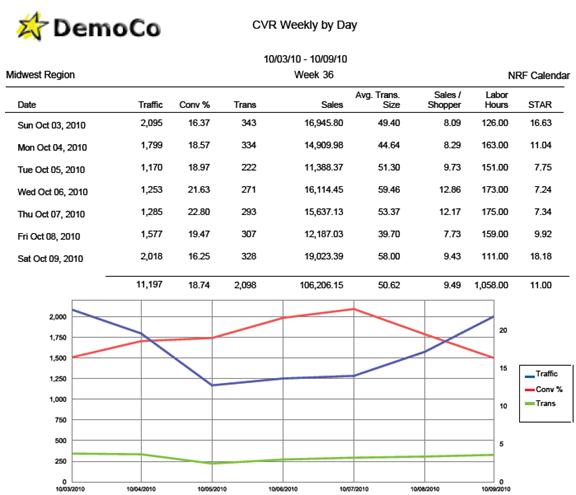
CVR Weekly by Day
A report available in the Identify Performers area. It displays totals of all
measurements for each day of the week for the specified period. It outputs a
separate page for each location, each week.
D
Daily Performance
A report available in the Uncover Opportunity area. It compares average
traffic, sales and labor by day of the week, as well as share of week by day.
It outputs a separate page for each location.
Daily
A report available in the Comp Store area. It compares average sales
measurements by day of the week and share of week by day, for current and
previous years. Results can be limited to specific days of the week. This
report contains comp store logic and outputs a separate page for each location.
Daily
A report available in the Uncover Opportunity area. It compares average sales
measures by day of the week and share of week by day, for two specified
periods. Results can be limited to specific days of the week. It outputs a
separate page for each location. (Please Note: This report does not contain
comp store logic. For that functionality, use the "Daily
Daily Traffic
A report in the Uncover Opportunity area. It compares average traffic by day of
the week and share of weekly traffic by day, for two specified periods. Results
can be limited to specific days of the week. It outputs a separate page for
each location.
Dollars per Shopper ($/Shopper)
H
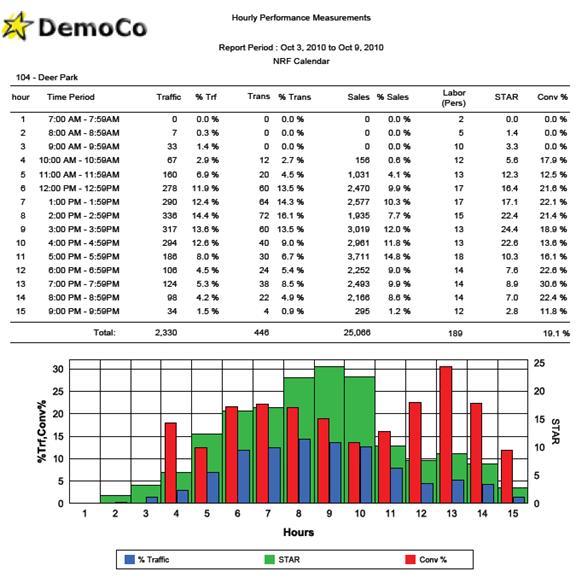
Hourly Performance
A report in the Uncover Opportunity area. It displays hourly totals of all measurements
for the specified period. It outputs a
separate page for each location.
I
Identify Performers
A category of report. All reports in this category enable performance
assessment with an emphasis on conversion rate over summarized time periods.
K
KPI (Key Performance Indicator)
A set of metrics used to gauge performance.
L
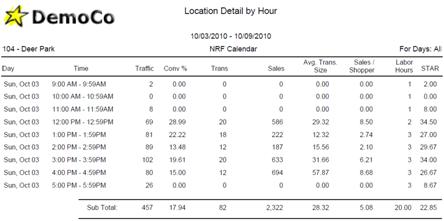
Location Detail by Hour
A report in the Uncover Opportunity area. It displays all performance
measurements for each day and hour in the specified period. It outputs a separate
page for each location, each day.
O
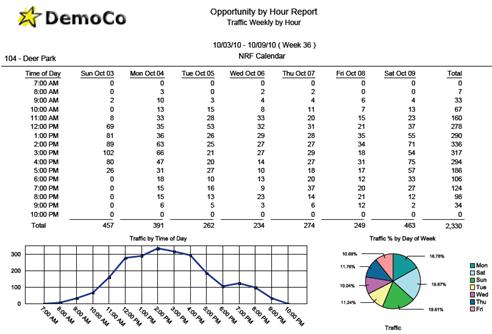
A report in the Uncover Opportunity area. It displays traffic by hour for each
day selected. It outputs a separate page for each location, each week.
P
Portfolio Tool
Available in the Analysis Toolkit area. It allows users to manipulate data
related to their complete roster of stores, regions and districts for a single
interval of time.
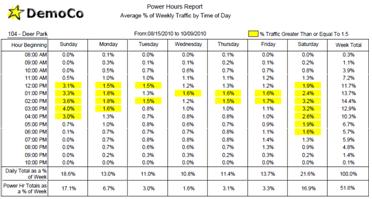
Power Hours
Hours during the week that account for a high percentage of weekly
traffic. Typically, Power Hours are
defined as an hour during the week that has 1.5% of the week’s traffic or
greater. However, the percentage
threshold can be adjusted.
Property Tool
Available in the Analysis Toolkit area. It allows users to view data related to
a particular store, region or district across many time periods.
S
Total sales amount, recorded by POS system.
Shopper to Associate Ratio (STAR)
Average number of shoppers each associate must service, per hour. Traffic
divided by sales labor.
SRTI (ShopperTrak Retail Traffic Index)
A traffic benchmarking tool used as a comparison for the performance of your
traffic. This is a projection of the
total universe of shopper traffic.
T
Traffic (Visitors)
Inbound traffic count for the period of interest.
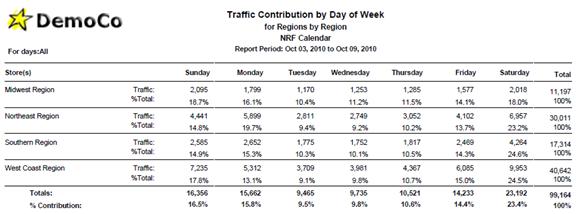
Traffic Contribution by DOW (Day of Week)
A report in the Uncover Opportunity area. It displays traffic by day as well as
traffic percentage by day of the week.
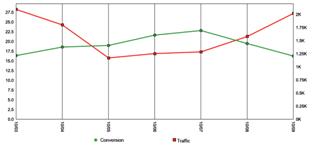
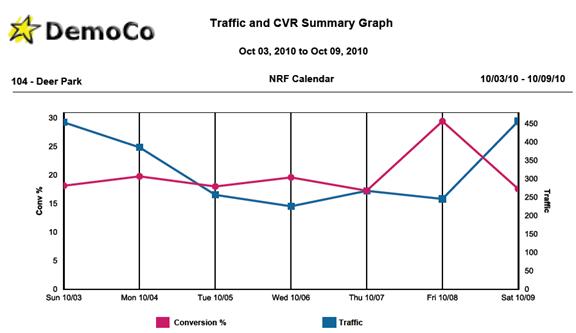
Traffic Graph
A report available in the Uncover Opportunity area. It plots traffic and
conversion rate for each day selected. It outputs one graph for each location,
each week; two graphs appear on each page.
Traffic/Trans/Conv
A report available in the Comp Store area. It compares traffic, transactions
and conversion rate totals only, by location, across the current and previous
years. Results can be limited to specific days of the week. All locations
appear on the same page. This report does contain comp store logic.
Transaction Count (Trans)
Number of transactions executed through the POS system. Multiple items
purchased at the same time count as a single transaction.
U
Uncover
A category of reports. All reports in this category allow users to drill down
to the day and hourly levels to identify trends and improvement opportunities.
W
Weekly Summary
A report available in the Comp Store area. It compares daily totals of all
measurements for the current year versus the previous year. Results can be
limited to specific days of the week. This report does contain comp store logic
and outputs a separate page for each location each week.
What If...
The Retail Traffic Analyzer's "What If..." capabilities allow users
to visualize the effect that a hypothetical increase in conversion rate would
have on sales. This feature is available in the Portfolio and Property Tools,
as well as the "CVR Forecast (What If)" report in the Uncover
Opportunity area.
Power Hours are defined as during the week
that account for a high percentage of weekly traffic. Typically, Power Hours are defined as an hour
during the week that has 1.5% of the week’s traffic or greater. However, the percentage threshold can be
adjusted. This report provides a quick
overview of the busiest times of day in your store.
A report available in the Identify
Performers area. It lists totals of all measurements by period for selected
locations. Results can be limited to specific days of the week. It outputs a
separate page for each location.
A report available in the Identify
Performers area. It lists totals of all measurements by location for the
selected period. Results can be limited to specific days of the week. It
outputs a separate page for each "Group/Show By" period.
A report available in the Identify
Performers area. It displays average conversion rate by location for up to 12
trailing periods. Results can be limited to specific days of the week. All
locations appear on the same page.
A report available in the Identify
Performers area. It displays totals of all measurements for each day of the
week for the specified period. It outputs a separate page for each location,
each week.
A report available in the Identify Performers area. It compares daily totals of
all measurements for two specified periods. The report outputs a separate page
for each location, each week. (Please Note: This report does not contain comp
store logic. For this type of functionality, use the "Comp Store Weekly
Summary" report.)
A report available in the Identify Performers area. It compares traffic,
transactions and conversion rate totals only, for two specified periods.
Results can be limited to specific days of the week. All locations appear on
the same page. (Please Note: This report does not contain comp store logic. For
this type of functionality, use the "Comp Store Traffic/Trans/Conv"
report.)
Uncover
A report available in the Uncover Opportunity area. It shows the change in all
measurements for each day in a specified period based on a hypothetical
increase in conversion rate. It outputs a separate page for each location and
week.
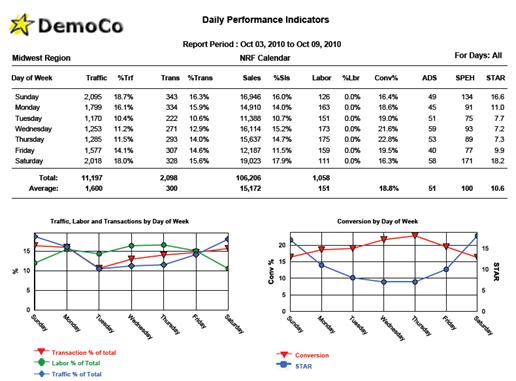
Daily
Performance Indicators Report
A report available in the Uncover Opportunity area. It compares average
traffic, sales and labor by day of the week, as well as share of week by day.
It outputs a separate page for each location.
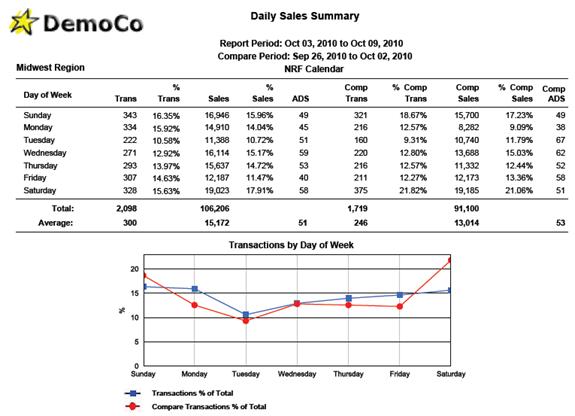
Daily
Sales Summary Report (Uncover
A report available in the Uncover Opportunity area. It compares average sales
measures by day of the week and share of week by day, for two specified
periods. Results can be limited to specific days of the week. It outputs a
separate page for each location. (Please Note: This report does not contain
comp store logic. For that functionality, use the "Daily
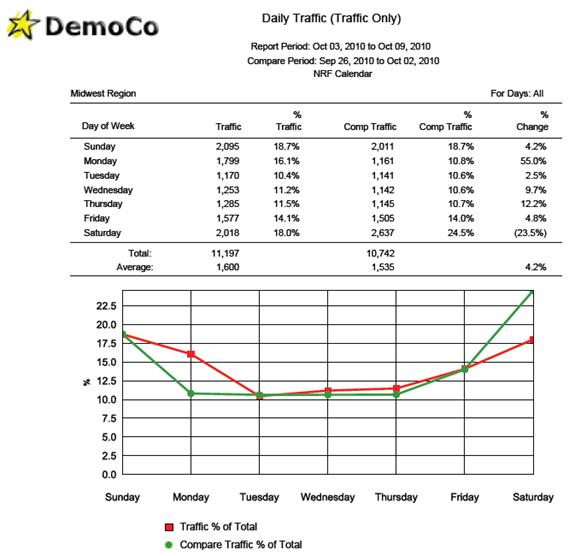
A report in the Uncover Opportunity area. It compares average traffic by day of
the week and share of weekly traffic by day, for two specified periods. Results
can be limited to specific days of the week. It outputs a separate page for
each location.
A report in the Uncover Opportunity area. It displays hourly totals of all
measurements for the specified period.
It outputs a separate page for each location.
Location
Detail by Hour Report
A report in the Uncover Opportunity area. It displays all performance
measurements for each day and hour in the specified period. It outputs a
separate page for each location, each day.
A report in the Uncover Opportunity area. It displays traffic by hour for each
day selected. It outputs a separate page for each location, each week.
Traffic
Contribution by DOW (Day of Week)
A report in the Uncover Opportunity area. It displays traffic by day as well as
traffic percentage by day of the week.
A report available in the Uncover Opportunity area. It plots traffic and
conversion rate for each day selected. It outputs one graph for each location,
each week; two graphs appear on each page.
A report available in the Comp Store area. It lists current- and previous-year
totals of all measurements by period for the selected locations. Results can be
limited to specific days of the week. This report outputs a separate page for
each location and does contain comp store logic.
A report available in the Comp Store area. It lists current- and previous-year
totals of all measures by location for the selected period. Results can be
limited to specific days of the week. This report does contain comp store logic
and outputs a separate page for each "Group/Show By" period.
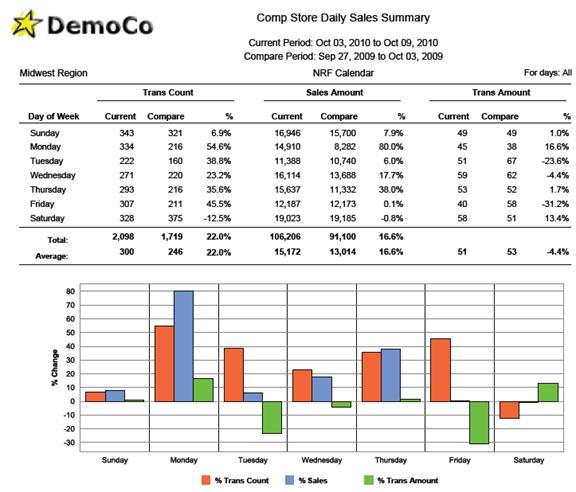
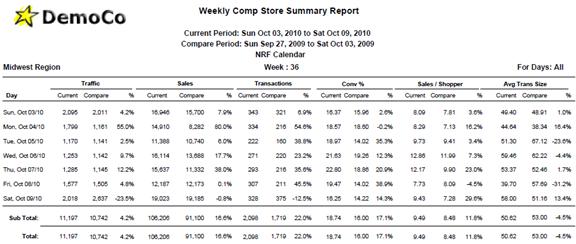
Comp
Store Daily Sales Summary Report
A report available in the Comp Store area. It compares average sales
measurements by day of the week and share of week by day, for current and
previous years. Results can be limited to specific days of the week. This
report contains comp store logic and outputs a separate page for each location.
A report available in the Comp Store area. It compares traffic, transactions
and conversion rate totals only, by location, across the current and previous
years. Results can be limited to specific days of the week. All locations
appear on the same page. This report does contain comp store logic.
A report available in the Comp Store area. It compares daily totals of all
measurements for the current year versus the previous year. Results can be
limited to specific days of the week. This report does contain comp store logic
and outputs a separate page for each location each week.
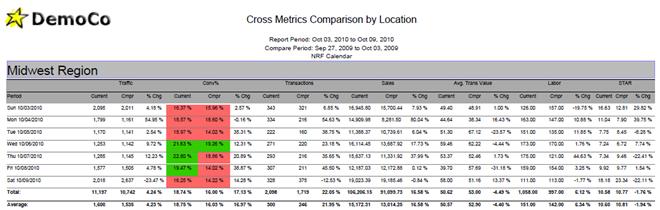
Cross
Metrics Comparison by Location Report
A report available in the Retail Metrics area.
This report compares all measures against two specified periods or
provides the measures for only one period.
It can be run with or without comp store logic and thresholds can be set
against any of the metrics to provide shading for values above and below the
thresholds. The user can select which
metrics to include in the report. This
report lists time periods in the rows and outputs a separate page for each
location.
Cross
Metrics Comparison by Period Report
A report available in the Retail Metrics area.
This report compares all measures against two specified periods or
provides the measures for only one period.
It can be run with or without comp store logic and thresholds can be set
against any of the metrics to provide shading for values above and below the
thresholds. The user can select which
metrics to include in the report. This
report lists locations in the rows and outputs a separate page for each time
period.